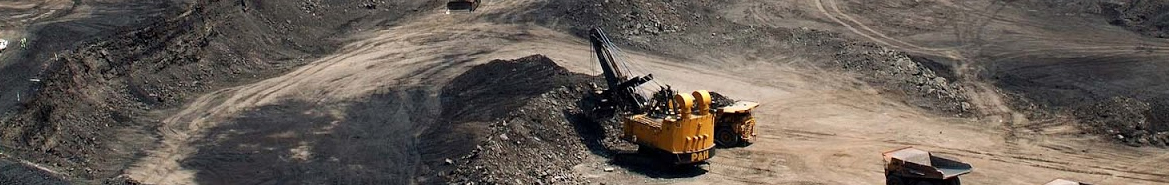
Mines
GVantage Technologies Limited is a is a holding company of Damash Minerals and GVantage Joint Venture, Senegal which holds a Mining Concession in Kolda, Northern Senegal. The total land periphery is about 2645 Sq.Kms and initially an area of around 8 Sq. Kms was explored by GVantage and reserves were found approximately 120 Million Metric Tons of Rock Phosphate reserves within this area.
GVantage has conducted Geo Physical Survey, Drilling Program, and Chemical Analysis and prepared the pre-feasibility report for the project is ready to start the production of Rock Phosphate.
GVantage plans to establish a Phosphoric Acid plant and eventually a DAP/NPK plant in Senegal.
The Rock Phosphate Project of GVantage:
Introduction:
Senegal could become one of the top ten producers of phosphate in the world. The West African country has a wide range of proven mineral resources but there are still many areas to be explored. Phosphate has been Senegal’s principal mining resource though in the past few years, there has been a boom in gold mining. Senegal’s state owned Industries Chimiques du Senegal (ICS) controls the majority of known phosphate reserves in the Taiba and Thies region; however, the government is very interested in attracting private foreign investment in the mining sector, which by 2015 is expected to reach some USD$ 5 billion. The phosphate fields in Taiba alone account the largest share of Senegal’s GDP but there are known phosphate deposits in northern Senegal waiting to be developed, which are said to be of high quality. These are located in the regions of Matam, Coki, Gossas and Niakhene. The potential is such that Senegal could soon move from producing 650,000 tons of phosphate (about the same as Canada) to over 1 million tons if the new areas are developed. There are several phosphate occurrences and deposits in Senegal. The four main phosphate deposits are: the Neoproterozoic/Cambrian phosphates in the Namel area, southeast Senegal, the Eocene phosphate deposits along the Senegal River, including the ‘Matam’ deposits, the Eocene primary phosphate deposits in western Senegal, mined at Taiba and Lam Lam, the aluminous phosphates of Thies, weathering products of the Eocene phosphates, found also in western Senegal.
The Proposed Exploration Program:
Based on the provided information, a detailed exploration program including topographic, geological, drilling, mining and reserve calculations surveys will be carried out in the proposed area at Kolda province-Senegal. The study aims to delineate the distribution and thickness of the commercial phosphate ore deposits as well as providing detailed study on the resources and reserve calculations, mining plan and cost estimation. The complete proposed area comprises an area of 10.7 km2 .
The survey work will include the following:
Topographic Survey The purpose of a topographic survey is to gather survey data about the natural and manmade features of the land, as well as its elevations. From this information a three dimensional map may be prepared.
The work usually consists of the following:
• Establishing horizontal and vertical control that will serve as the framework of the survey.
• Determining enough horizontal location and elevation (usually called side shots) of ground points to provide enough data for plotting when the map is prepared.
• Locating natural and man-made features that may be required by the purpose of the survey.
• Computing distances, angles, and elevations.
• Drawing the topographic map To produce a topographic map at scale of 1:5000 for the area, a digital elevation model (DIM) will be built from satellite images supported with ground surveying for verification of the topographic data.
DEM extraction is a multi-step decision making process involving the setting of many parameters used in different steps. The following are the general steps that will be followed in order to extract a DEM from satellite imagery for the study area:
1. A stereo pair of satellite images covering the study area with Rational Polynomial Coefficients (RPC) will be collected. RPCs are used to generate Tie Points (TP) and to calculate the stereo image pair relationship.
2. The collected stereo pair of images will be pre-processed for any natural and artificial artifacts.
3. Internal and external orientations of the stereo pair of images using a suitable number of well-distributed Ground Control Points (GCP), Tie Points (TP), and Check Points (CP) will be estimated.
4. Interpretation of the stereo pairs of satellite images with acceptable pixel size and resolution covering the study in order to produce a DEM from the satellite stereo pairs. Finally, a triangulated irregular network (TIN) will be constructed.
5. The generated DEM will be interactively examined, edited, and corrected for incorrect values and the accuracy of the DEM will be evaluated.
6. Collection of ground elevation points from the area using the DEM data
7. Collection of ground topographic points using surveying methods by a total Station Leica 407.
8. Collection of 250 GCP points from the study area by the surveyor.
9. Marking of 50 bench marks by the surveyor in the study area and given serial numbers from 1–50.
10. All observation will be tied to the closest national geodetic network triangulation points in order to obtain point coordination and elevation. Deliveries
1. Raw observation data for total station with computation or data processing results.
2. A List of ground control and check points showing the point coordinates and a sketch drawing illustrating the exact point location on the ground
3. Topographic map at scale of 1:5000 showing all information using cartographic standards with suitable contour intervals.
4. The topographic maps will be in print form and as soft copy in a CD. Watersheds and Streams Mapping Watershed analysis usually requires a DEM. The DEM, which was developed, will be used to create a flow direction model in raster format. The flow direction model shows the direction water will flow out of each cell of a DEM. Then, a flow accumulation model in raster format will be calculated. Cells having high accumulation values generally correspond to stream channels, whereas cells having an accumulation value of zero generally correspond to ridge lines. Both flow direction and flow accumulation models will be used to create watersheds and streams layers for the study area in vector format. 2.2 Geological mapping A geologic map or geological map is a special-purpose map made to show geological features. Rock units or geologic strata are shown by color or symbols to indicate where they are exposed at the surface. Bedding planes and structural features such as faults, folds, foliations, and lineation are shown with strike and dip or trend and plunge symbols which give these features' three-dimensional orientations. Stratigraphic contour lines may be used to illustrate the surface of a selected stratum illustrating the subsurface topographic trends of the strata. Isopach maps detail the variations in thickness of stratigraphic units. It is not always possible to properly show this when the strata are extremely fractured, mixed, in some discontinuities, or where they are otherwise disturbed. A field work involved interpretation of aerial photographs, checking lineaments and geological boundaries and a GIS data, will be carried out to produce 1: 5000 geological map of the study area, A geological cross and columnar sections will be made.
All will be done through the following:
i) Review of geological setting of the study area
ii) Review of available existing geological and structural maps
iii) Interpretation of the available aerial photographs and satellite images at different scales
iv) Detailed geological mapping will be conducted to prepare a geologic map at a scale of 1:5000
v) Data Posting
(1) Projection of the lithological contacts and structural features
(2) Detailed assessment of structures/rock contacts
(3) Projection of the alluvial deposits vi) Preparation of the geological map with cross sections and columnar section. vii) Reasonable numbers of lithological vertical sections will be drawn viii) The geological map will be printed on an A0 papers. A soft copy will be presented in a CD Several field trips are needed to measure the fault-slip data such as the attitudes of the fault planes, trend and plunge of slickenside, in addition to determine the since of movements along the fault plane.
The activities required to achieve the expected results structurally;
(1) measure the attitudes of structural elements (bedding planes, faults, folds, hinge lines, joints…etc),
(2) measure slickenside lineation of the fault plane,
(3) find the relationship between the different structural elements,
(4) enter all these data to special computer programs for the interpretation of the collected data. These programs are TENSOR, SURFER 8, ArcGIS, ROCKWARE 2006, GEO Calculator, Corel Draw and
(5) drawing of structural maps, cross sections and diagrams.
Building a GIS Geo-database (Geomatics) An Extra aim of this study is to build a GIS-based geo-database comprising all the geographically referenced data that will be collected and compiled for the study area. Preparation of digital base map in the form of GIS layers as follows: • DEM layer • Line contours layer • Point spot height layer • Line wadies layer • Line tracks layer (watersheds and streams) • The geological map will be integrated in the GIS layers • Geomatics report on GIS and surveying operation showing procedures and results.